The Statistician's Stomach: Mollie Orshansky and the Moral Arithmetic of Poverty
Statistics has often been described as a technology of distance, a method for rendering populations legible to a state that governs from afar (Porter, 1995). At its most callous, it has been used to pathologise the vulnerable and justify their exclusion. The eugenic statistics of Francis Galton and Karl Pearson, for instance, were forged not to alleviate poverty but to prove it was a hereditary stain on the body politic, a biological flaw to be managed rather than a condition to be remedied (Aylward, 2021). Theirs was a mathematics of exclusion, wielded by a privileged class to rationalise the social order from which they benefited. Yet the history of statistics also contains a powerful counter-tradition, one in which quantitative methods are used not to create distance, but to foster proximity and articulate a case for justice. Today, as automated algorithms are increasingly deployed in social welfare, they risk creating a new form of technical and ethical distance, making the lessons of this counter-tradition more urgent than ever.
This essay argues that the work of Mollie Orshansky (1915—2006) represents a pivotal example of this approach to statistics. As an economist for the U.S. Social Security Administration, Orshansky developed the nation’s first official poverty measure. This act was more than a technical achievement; it was a profound moral and epistemological break from the eugenic logic that had preceded it. While Galton and Pearson sought to ground social hierarchy in biology, Orshansky grounded her measure of poverty in the material reality of household consumption—in the price of milk, bread, and beans. Drawing on the concurrent rise of social surveys and the empirical focus of the home economics movement, she anchored her statistics in lived experience, making deprivation visible and legible to the state not as a sign of individual deficiency, but as a condition of material need. This essay will first trace the origins of her perspective in her biography and the intellectual context of her time. It will then detail the construction of her poverty thresholds, before contrasting her human-centred methodology with the exclusionary logic of her eugenicist predecessors. Finally, it will conclude by exploring the relevance of her ethical framework in our current landscape of Big Data and algorithmic welfare.
This essay won the British Society for the History of Mathematics Undergraduate Essay Prize, 2025.
The Education of a Social Statistician
Born in January 1915 to Ukrainian-Jewish immigrants, Mollie Orshansky grew up in a six-daughter household packed into a small Bronx tenement. Her parents had fled antisemitic violence and stitched together a living in New York by hawking clothing from pushcarts and doing piece-work in a garment factory. Family stories of pooling coins to buy bread and potatoes were not romantic anecdotes; they were the arithmetic of survival. This upbringing shaped her lifelong conviction that statistical work must be grounded in material reality. As she would later state, her deep understanding of poverty was not theoretical: “If I write about the poor, I don’t need a good imagination, I have a good memory” (Eaton, 1970).
Despite economic pressures, her parents prized education. Orshansky excelled at school and won a place at Hunter College, one of the few New York institutions open to working-class women and Jews. There she majored in mathematics and statistics, graduating in 1935. She continued her studies in economics part-time at American University after moving to Washington, D.C. for a federal job. Her career began in 1936 at the U.S. Children’s Bureau, where a key part of her role was answering correspondence from the public. This position put her in direct contact with the daily struggles of families across the country, providing an education in human need that statistical abstracts alone could not offer.
Her perspective was further shaped by the burgeoning fields of social surveying and home economics. These disciplines were deeply empirical, focused on documenting the actual conditions of American life. In 1945, Orshansky joined the Bureau of Human Nutrition and Home Economics at the U.S. Department of Agriculture (USDA), a hub for this kind of research. There, she spent thirteen years immersed in the data of American household life, developing low-cost meal plans and supervising the massive 1955 Household Food Consumption Survey, a nationwide study of what Americans actually ate and what they spent. This work left her fluent not only in survey design but in the details of how, for example, the price of evaporated milk could decide whether a child received sufficient calcium.
When she moved to the Social Security Administration (SSA) in 1958, she carried with her an unrivalled grasp of household economics. Unlike many SSA actuaries who approached welfare through macro-trends and insurance formulas, Orshansky approached it through kitchens and shopping lists. Both her lived experience of material want and her professional expertise in household budgets gave her a unique perspective. This background allowed her, a few years later, to construct a poverty measure rooted in what families actually bought, ensuring the mathematics of America’s poverty line would be traced not to abstract theory, but to the real-world cost of living.
Constructing the Poverty Threshold
When Orshansky arrived at the SSA, the United States had no consistent answer to the question of what it meant to be poor. The available yardsticks, arbitrary income lines and outdated budget estimates, failed to reflect, in her view, what a modern society should consider a minimally adequate standard of living. She argued that “if it is not possible to state unequivocally ‘how much is enough,’ it should be possible to assert with confidence how much, on an average, is too little” (Orshansky, 1965, p. 3). Her solution was to ground this assertion in empirical reality, anchoring her definition of poverty in the one area where a standard of adequacy existed: the cost of food.
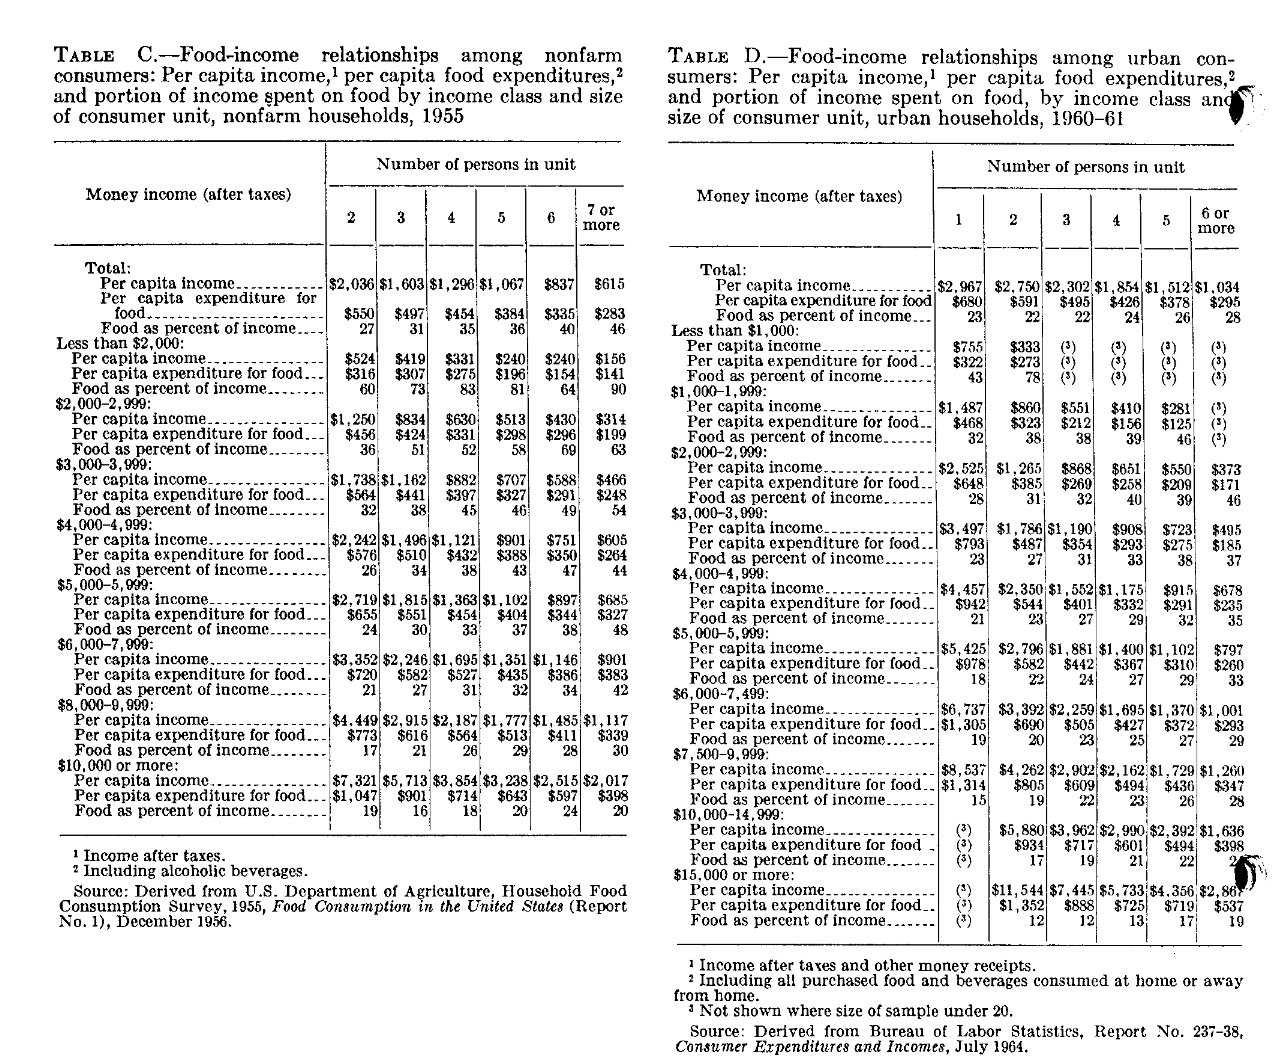
From her USDA years, Orshansky knew the agency maintained several food plans providing a nutritionally adequate diet at different cost levels. The Economy Food Plan (EFP) was the rock-bottom option, designed for ‘temporary or emergency use when funds are low’ (Orshansky, 1965, p. 6). Using data from the 1955 Household Food Consumption Survey, she observed a critical regularity: for the average family of three or more persons, food expenditure represented approximately one-third of their total after-tax income. This empirical finding became the cornerstone of her model. The logic was simple yet powerful:
where is the poverty threshold and is the cost of the Economy Food Plan for a specific family type. A household with an income below this threshold would, by definition, be unable to afford even the cheapest adequate diet without sacrificing other necessities like housing and clothing.
Orshansky rejected a single poverty line, arguing it failed to capture the diverse circumstances of American households. The choice was between the cold, exclusionary arithmetic of a single number, and the compassionate mathematics of a detailed matrix. She chose the latter, constructing a table of 124 different thresholds which varied by household size, number of children, age of the head of household, and farm vs. non-farm residency (Orshansky, 1965, p. 28). This complex grid was an explicit recognition that need is not uniform. Thresholds for an elderly couple were lower than for a young couple with three children, reflecting different caloric requirements and living expenses. This granular approach, built from the ground up on the living truth of deprivation, was a direct rebuke to the top-down, homogenising logic of earlier statistical traditions.
Orshansky was her own shrewdest critic, candidly stating in her 1965 paper that “The measure of poverty thus developed is arbitrary. Few could call it too high. Many might find it too low” (p. 10). She understood that a poverty line based solely on a food-to-income ratio was merely an “interim guide” and that its greatest flaw was its lack of geographic variation to account for differing costs of living (p. 12). Despite these limitations, the thresholds gained rapid acceptance. When tested against 1963 data, their ability to identify about one-fifth of all U.S. children as poor aligned with independent data on hardship, giving the measure a validity that convinced policymakers of its utility. By 1969, Orshansky’s thresholds were adopted as the official statistical definition of poverty across the federal government (Fisher, 1997, p. 9), establishing a grounded, empirical approach that, as the next section will show, stood in stark opposition to the dominant statistical traditions of the preceding era.
Statistics as Exclusion vs. Statistics as Solidarity
Long before Mollie Orshansky translated grocery lists into federal policy, the dominant current in English-language statistics was forged by patrician scholars who regarded poverty as a biological blemish. Francis Galton (1822—1911) and Karl Pearson (1857—1936), both born into comfort and insulated from material want, believed that the social order of Victorian and Edwardian Britain reflected a natural order of hereditary merit. Their quantitative tools were explicitly fashioned to defend that conviction (MacKenzie, 1981).
Galton, a cousin of Charles Darwin, used statistical methods to argue that social position was a direct consequence of genetic worth. In his text, Hereditary Genius (1869), he was unambiguous about the social policy his findings demanded. He argued that society should actively intervene in human reproduction to improve the “national stock.” In his vision for a eugenically-ordered civilization, there was a clear, prescribed place for the poor:
The weak could find a welcome and a refuge in celibate monasteries or sisterhoods, and… the improvident were rigidly restrained from breeding. (Galton, 1869, p. 362)
Here, “improvident” was a common Victorian term for the poor and working classes, those deemed to lack the foresight and thrift of their social superiors. For Galton, statistics was a tool to identify these groups so they could be “rigidly restrained.” His disciple, Karl Pearson, gave mathematical teeth and a fiercer political edge to these ideas. A committed eugenicist, Pearson used his statistical innovations to argue for a form of social Darwinism, framing state support for the poor as a direct threat to national and imperial strength. In his influential lecture, National Life from the Standpoint of Science (1900), he argued:
You have to select your fittest, let the unfit die out… I say that the nation which has the best men, the best brains, the best workers, will in the long run have the best credit, the best capital, and the best enterprise… You must not allow inferior stock to multiply at the expense of the better. (Pearson, 1900, pp. 26—27, 46)
For both men, the purpose of statistical enumeration was to identify, quarantine, and ultimately manage the reproduction of those they deemed biologically unfit. Their work, reflecting Victorian anxieties about imperial decline and urban crowding, framed the poor as a reproductive threat. Statistical tables supplied the veneer of scientific inevitability.
Mollie Orshansky’s work, by contrast, was driven by a desire to render the unseen visible. “Poor people are everywhere; yet they are invisible,” she later told a reporter. “I wanted them to be seen clearly by those who make decisions about their lives” (Cassidy, 2006). Her work represented a root-and-branch inversion of the eugenic project, beginning with the very object of measurement. Where the eugenicists sought to measure innate “hereditary fitness,” Orshansky measured the material cost of subsistence. This shifted the entire moral axis of her work. As she stated in her foundational 1965 paper, her aim was to identify those for whom “everyday living implied choosing between an adequate diet of the most economical sort and some other necessity because there was not money enough to have both” (Orshansky, 1965, p. 4).
This led to a profound difference in the unit of analysis and the ultimate policy goal. The eugenic project focused on the “defective type,” a dangerous abstraction used to homogenise the poor into a single biological threat. The policy goal was, accordingly, to limit the reproduction of that type. Orshansky’s model, with its matrix of 124 distinct thresholds, rejected this logic entirely. Her unit of analysis was not the abstract type but the diverse household. Her policy goal was not to manage breeding patterns, but to allocate resources to help real families survive. Instead of counting paupers to justify sterilisation, she counted the cost of food to justify assistance.
Her poverty thresholds were therefore structural, not biological; they measured purchasing power, not pedigree. Historian Dorothy Ross has observed that statistics can operate as a ‘technology of distance’. Galton’s and Pearson’s tables are a prime example, allowing gentlemen scientists to pronounce on slum populations they rarely encountered and reinforcing social hierarchy through a veneer of objectivity. Orshansky’s work deliberately collapsed that distance. Her multiplier turned arcane survey data into a relatable metric: could a family buy enough food and still pay rent? Crucially, her method made no claim about moral worth. A family whose income fell $10 below the threshold was not biologically defective; it was hungry. In replacing heredity with household need, she transformed statistics from a gatekeeping device into what the economist Amartya Sen would later call an ‘informational basis of justice’. The contrast could not be starker: where Galton and Pearson saw in poverty a failing of bloodlines and the ruin of Empire, Orshansky saw a public obligation measured in dollars and cents.
Algorithms and the New Poorhouse
The twenty-first-century welfare state, freshly equipped with predictive analytics and automated decision-making, risks returning to the very pathologies that Orshansky’s grounded thresholds once countered. In Automating Inequality (2018), Virginia Eubanks argues that these automated systems serve a familiar, troubling purpose:
Like earlier technological innovations in poverty management, digital tracking and automated decision-making hide poverty from the professional middle-class public and give the nation the ethical distance it needs to make inhuman choices: who gets food and who starves, who has housing and who remains homeless, and which families are broken up by the state. (Eubanks, 2018, p. 13)
This is not a uniquely American phenomenon. In the United Kingdom, parallel concerns have been raised about the Department for Work and Pensions (DWP), which uses automated systems to administer Universal Credit and detect potential fraud. A stark example emerged when a DWP algorithm wrongly flagged over 200,000 legitimate housing benefit claims as high-risk, subjecting thousands of households to unnecessary fraud investigations based on a secret, faulty risk score (Tapper, 2024).
This algorithmic opacity reinstates the ethical distance that Orshansky fought to close. As one American welfare recipient told Eubanks after being wrongly cut off from benefits, ‘I never met the person who decided I didn’t need help, because it wasn’t a person at all’ (Eubanks, 2018, p. 67). That same sense of powerlessness is felt in the UK, where claimants are judged by systems they cannot see or understand. Where Orshansky’s multiplier was a transparent rule any citizen could check, modern welfare algorithms in both the US and UK transform poverty into a proprietary risk score.
Far from neutral, these automated systems learn from historical data steeped in discrimination. Ruha Benjamin (2019) terms this recursive loop the ‘New Jim Code’: technologies that reflect and reproduce existing inequities but are promoted as objective or progressive. A parallel dynamic is visible in the UK, where official reports have acknowledged that DWP algorithms can be biased against vulnerable groups, with a risk of discriminating on the basis of disability, age, or nationality (National Audit Office, 2023, p. 48). By collapsing diverse households into aggregated risk tiers, these systems also erode the granularity central to Orshansky’s matrix, trading nuance for scale.
The contrast underscores Orshansky’s continuing relevance. Her model’s legibility allowed for scrutiny and debate. Transparency is not a luxury; it is a safeguard against the silent reproduction of bias. If algorithms are to govern the social safety net, they must emulate the epistemic humility embedded in Orshansky’s work. Her career teaches that statistics can either magnify invisibility or dismantle it; the choice lies not in the power of computation but in the ethics of design.
Conclusion: Toward an Ethics of Measurement
Mollie Orshansky’s achievement was never just the neat equation ; it was the conviction that counting people begins with listening to them. By rooting statistical thresholds in grocery budgets and household composition, she forged a mathematics of care that made deprivation visible and negotiable. Her method exposed the fiction, promoted by Galton, Pearson, and their successors, that numbers can float above class and power. In truth, every dataset is inscribed with the experiences, assumptions, and blind spots of its authors.
That lesson is as urgent and relevant now as then. Artificial intelligence now shapes eligibility for benefits, sets credit limits, and flags ‘risky’ families for state intervention. We are already constructing what could be termed black-box eugenics: an infrastructure that revives the old project of ranking lives while hiding its mechanics behind proprietary code and opaque machine learning. When an applicant is auto-denied because a neural network discovered a spurious correlation, who can interrogate the logic hidden in millions of parameters? Accountability dissolves into a web of distributed, automated processes for which no single actor takes responsibility.
Orshansky’s legacy provides a blueprint for resisting this drift. Models of social need must be anchored in transparent, publicly intelligible benchmarks, not inscrutable feature sets. The people whose lives are measured must be involved in auditing the metrics. And statistical power must never eclipse a substantive understanding of poverty’s structural roots. An enduring tension exists between the two visions of social measurement. The eugenic impulse to categorise and exclude, often cloaked in the seemingly neutral language of science and technology, persists. Orshansky’s work serves as a powerful reminder that data is never raw; it is shaped by hidden drives and biases. Her life and career demonstrate the necessity of remaining vigilant, of questioning the assumptions embedded in our models, and of insisting that any system designed to serve people must be built with their input, not in spite of their absence.
References
Aylward, A. (2021). Eugenics, ‘hereditary genius,’ and the making of the modern life sciences. Studies in History and Philosophy of Science Part C: Studies in History and Philosophy of Biological and Biomedical Sciences, 89, 146—156.
Benjamin, R. (2019). Race After Technology. Cambridge: Polity.
Cassidy, J. (2006, April 3). Relatively deprived. The New Yorker. Available at: https://www.newyorker.com/magazine/2006/04/03/relatively-deprived (Accessed 24 June 2025).
Eaton, William J. (1970). The poverty line. New York Post. April 4, 24.
Eubanks, V. (2018). Automating Inequality. New York: St Martin’s Press.
Fisher, G. M. (1997). The Development and History of the US Poverty Thresholds. Social Security Bulletin, 55(4), 3—14.
Galton, F. (1869). Hereditary Genius. London: Macmillan.
Kevles, D. J. (1985). In the Name of Eugenics: Genetics and the Uses of Human Heredity. New York: Alfred A. Knopf.
MacKenzie, D. A. (1981). Statistics in Britain, 1865—1930: The Social Construction of Scientific Knowledge. Edinburgh: Edinburgh University Press.
National Audit Office. (2023, July 13). Report on Accounts: Department for Work & Pensions. Available at: https://www.nao.org.uk/reports/department-for-work-pensions-annual-report-and-accounts-2022-23/ (Accessed 24 June 2025).
Orshansky, M. (1965). Counting the Poor: Another Look at the Poverty Profile. Social Security Bulletin, 28(1), 3—29.
Orshansky, M. (1988). Commentary: The Poverty Measure. Social Security Bulletin, 51(10), 22—24.
Pearson, K. (1903). The Laws of Eugenics. London: Dulau.
Porter, T. M. (1995). Trust in Numbers: The Pursuit of Objectivity in Science and Public Life. Princeton, NJ: Princeton University Press.
Ross, D. (1991). The Origins of American Social Science. Cambridge: CUP.
Sen, A. (1999). Development as Freedom. Oxford: OUP.
Tapper, H. (2024, June 23). DWP algorithm wrongly flags 200,000 people for possible fraud and error. The Guardian. Available at: https://www.theguardian.com/society/article/2024/jun/23/dwp-algorithm-wrongly-flags-200000-people-possible-fraud-error (Accessed 24 June 2025).
U.S. Census Bureau. (n.d.). History of the Poverty Measure. Available at: https://www.census.gov/topics/income-poverty/poverty/about/history-of-the-poverty-measure.html (Accessed 24 June 2025).